Tuesday, August 28, 2012

Buildbot Part IV: Customize the scheduler

My previous post was about customizing buildbot to display more information on the waterfall page. Now let’s customize the scheduler to trigger the knightly build only if the continuous one hasn’t failed.

One way to accomplish this is by adding a new scheduler called DependentNightly, this scheduler receives a new parameter called relatedBuilderNames containing a set of builders that the scheduler should watch. The startbuild method will now check, for every related builder, the last finished build status and start the knightly build if no failures are found. Bellow master.cfg changes.

from buildbot.schedulers.basic import SingleBranchScheduler
from buildbot.schedulers.timed import Nightly
from buildbot.changes import filter
from buildbot.status.builder import SUCCESS, WARNINGS, FAILURE
from twisted.python import log
from twisted.internet import defer

class DependentNightly(Nightly):

    relatedBuilderNames = []
    
    def __init__(self, relatedBuilderNames = [], **kwargs):
        Nightly.__init__(self, **kwargs)
        self.relatedBuilderNames = relatedBuilderNames

    def startBuild(self):
        startBuild = True
        for builderName in  self.relatedBuilderNames:
            builder_status = self.master.status.getBuilder(builderName)
            lastBuild = builder_status.getLastFinishedBuild()
            if lastBuild != None:
                startBuild = startBuild and (lastBuild.getResults() != FAILURE)

        if (startBuild):
            return Nightly.startBuild(self)
        else:
            log.msg(("Nightly Scheduler <%s>: skipping build. " +
                         "- Related builder <%s> failed last build")
                        % (self.name, ", ".join(self.relatedBuilderNames)))
            return defer.succeed(None)   

c['schedulers'] = []
c['schedulers'].append(SingleBranchScheduler(
                            name="Continuous",
                            change_filter=filter.ChangeFilter(branch='master'),
                            treeStableTimer=3*60,
                            builderNames=["Continuous"]))
c['schedulers'].append(DependentNightly(
                            name="Ninghtly",
                            branch='master',
                            hour=13,
                            minute=24,
                            onlyIfChanged=False,
                            builderNames=["Ninghtly"],
                            relatedBuilderNames=["Continuous"] ))


When the scheduler finds out that the build won’t run, a message will be log to twistd.log file as shown bellow.

skippingknightly

I hope this series of blog posts were helpful to give you an overall idea about using buildbot for CI.

Thursday, August 23, 2012

Buildbot Part III: Customizations

On my previous post we configured buildbot to run automated build and tests. Now, let’s add customizations, usually this configurations consists of subclasses set up for use in a regular buildbot configuration file (master.cfg).

Display more information in the waterfall

The first customization will be adding detail information in the waterfall page. One way to do this is writing a new custom buildstep. Most shell commands emit messages to stdout/stderr as they run, we will get output information from xunit.console.exe and use the functions provided by buildbot to perform summarization of the step base on the content of the stdio logfile. Bellow changes done to display details about the tests executed in a dll: total, failed, skipped and the time it took to perform the tests.

class xUnitConsole(ShellCommand):
    def __init__(self, **kwargs):
        ShellCommand.__init__(self, **kwargs)

    def describe(self, done=False):
        description = ShellCommand.describe(self,done)
        if done:
            description.append('total: %d ' % self.step_status.getStatistic('total', 0))
            failed = self.step_status.getStatistic('failed', 0)
            if failed > 0:
                description.append('failed: %d' % failed)
            skipped = self.step_status.getStatistic('skipped', 0)
            if skipped > 0:
                description.append('skipped: %d' % skipped)
            description.append('took: %s seconds' % self.step_status.getStatistic('time', 0))                
            
        return description

    def createSummary(self,log):
        _re_result = re.compile(r'(\d*) total, (\d*) failed, (\d*) skipped, took (.*) seconds')
        
        total = 0
        failed = 0
        skipped = 0
        time = 0
        
        lines = self.getLog('stdio').readlines()
        
        for l in lines:
            m = _re_result.search(l)
            if m:                
                total = int(m.group(1))
                failed = int(m.group(2))
                skipped = int(m.group(3))
                time = m.group(4)
              
        self.step_status.setStatistic('total', total)
        self.step_status.setStatistic('failed', failed)
        self.step_status.setStatistic('skipped', skipped)
        self.step_status.setStatistic('time', time)

def RunTests(factory, testproject, configuration, testdirectory):
        factory.addStep(xUnitConsole(command=['src\\xunit.console\\bin\\%s\\xunit.console.exe' % configuration,
                                '%s\\%s' % (testdirectory, testproject), "/html", "%s\\testresults.html" % testdirectory],
                                     workdir='build\\', name="Run %s" % testproject,
                                     description="Running %s" % testproject ,
                                     descriptionDone="Run %s done" % testproject,
                                     flunkOnFailure=False, warnOnFailure=True))


We switched from using ShellCommand to use the new one xUnitConsole, bellow an image with the new information displayed in the waterfall page. 

buildbot-moreinfo

you can follow a similar approach to display more information in compiling buildstep, check the visual studio buildstep in vstudio.py.

xunit.net report

Next customization will be adding a link to the report generated by xunit.console. The ShellCommand has the parameter logfiles that is useful in this case, when a command logs information in a local file rather than emitting everything to stdout/stderr.  By setting lazylogfiles=True, logfiles will be tracked lazily, meaning they will only be added when and if something is written to them. Finally, the addHtmllog adds a logfile containing pre-formatted HTML.  Bellow the changes done in master.cfg.

class  xUnitConsole(ShellCommand):    

    def __init__(self, xunitreport=None, **kwargs):
        ShellCommand.__init__(self, **kwargs)

    def describe(self, done=False):
        description = ShellCommand.describe(self,done)
        
        if done:
            description.append('total: %d ' % self.step_status.getStatistic('total', 0))
            failed = self.step_status.getStatistic('failed', 0)
            if failed > 0:
                description.append('failed: %d' % failed)
            skipped = self.step_status.getStatistic('skipped', 0)
            if skipped > 0:
                description.append('skipped: %d' % skipped)
            description.append('took: %s seconds' % self.step_status.getStatistic('time', 0))                
            
        return description

    def createSummary(self,log):
        html = self.getLog("xunit-report")
        text = html.getText()
        self.addHTMLLog("xunit-report.html", text)
        
        _re_result = re.compile(r'(\d*) total, (\d*) failed, (\d*) skipped, took (.*) seconds')
        
        total = 0
        failed = 0
        skipped = 0
        time = 0
        
        lines = self.getLog('stdio').readlines()
        
        for l in lines:
            m = _re_result.search(l)
            if m:                
                total = int(m.group(1))
                failed = int(m.group(2))
                skipped = int(m.group(3))
                time = m.group(4)
              
        self.step_status.setStatistic('total', total)
        self.step_status.setStatistic('failed', failed)
        self.step_status.setStatistic('skipped', skipped)
        self.step_status.setStatistic('time', time)

def RunTests(factory, testproject, configuration, testdirectory):
        factory.addStep(xUnitConsole(command=['src\\xunit.console\\bin\\%s\\xunit.console.exe' % configuration,
                                '%s\\%s' % (testdirectory, testproject), "/html", "%s\\testresults.html" % testdirectory],
                                     workdir='build\\', name="Run %s" % testproject,
                                     description="Running %s" % testproject ,
                                     descriptionDone="Run %s done" % testproject,
                                     flunkOnFailure=False, warnOnFailure=True,
                                     logfiles = {"xunit-report" : "%s\\testresults.html" % testdirectory }, lazylogfiles=True))


The waterfall page now has a link to xunit.net report, as you can see bellow:

Buildbot-reportxunitreport

On my next post I’ll show you how to customize the scheduler.

Thursday, August 9, 2012

Buildbot Part II – Running automated build and tests

On my previous post we setup buildbot. Now, let’s configure it to run automated builds and tests. To do this, I’ll be using my xUnit.Net fork hosted on git/codeplex.
Make the following changes to master.cfg:

Connect to the buildslave

c['slaves'] = [BuildSlave("BuildSlave01", "mysecretpwd")]

Track repository – GitPoller

The gitpoller periodically fetches from a remote git repository and process any changes.

from buildbot.changes.gitpoller import GitPoller
c['change_source'] = []
c['change_source'].append(GitPoller(
        'https://git01.codeplex.com/forks/mariangemarcano/xunit',
        gitbin='C:\\Program Files (x86)\\Git\\bin\\git.exe',
        workdir='gitpoller_work',
        pollinterval=300))

Add scheduler

There are different types of schedulers supported by buildbot and you can customize it. Let’s add a single branch scheduler to run the build whenever a change is committed to the repository and knightly schedulers to run the build once a day.

from buildbot.schedulers.basic import SingleBranchScheduler
from buildbot.schedulers.timed import Nightly
from buildbot.changes import filter

c['schedulers'] = []
c['schedulers'].append(SingleBranchScheduler(
                            name="Continuous",
                            change_filter=filter.ChangeFilter(branch='master'),
                            treeStableTimer=3*60,
                            builderNames=["Continuous"]))
c['schedulers'].append(Nightly(
                            name="Ninghtly",
                            branch='master',
                            hour=3,
                            minute=30,
                            onlyIfChanged=True,
                            builderNames=["Ninghtly"]))

Define a Build Factory

It contains the steps that a build will follow. In our case, we need to get source from repository, compile xunit.net projects and run the tests.

Get source from repository: Let’s do an incremental update for continuous build and compile debug; the full build will do a full repository checkout and compile using release configuration. The git factory needs to access git binaries, set the environment path to where you install it for example: C:\Program Files (x86)\Git\bin\.

Compile xunit.net and run tests: Let’s compile using MSbuild.exe and run the tests with xunit.console.exe. By setting flunkOnFailure=False/warnOnFailure=True, test failures will mark the overall build as having warnings.

from buildbot.process.factory import BuildFactory
from buildbot.steps.source.git import Git
from buildbot.steps.shell import ShellCommand

def MSBuildFramework4(factory, configuration, projectdir):
    factory.addStep(ShellCommand(command=['%windir%\\Microsoft.NET\\Framework\\v4.0.30319\\MSbuild.exe',
                                          'xunit.msbuild', '/t:Build', '/p:Configuration=%s' % configuration],
                                 workdir=projectdir, name="Compile xunit.net projects",
                                 description="Compiling xunit.net projects",
                                 descriptionDone="Copile xunit.net projects done"))

def RunTests(factory, testproject, configuration, testdirectory):
        factory.addStep(ShellCommand(command=['src\\xunit.console\\bin\\%s\\xunit.console.exe' % configuration,
                                '%s\\%s' % (testdirectory, testproject), "/html", "%s\\testresults.html" % testdirectory],
                                     workdir='build\\', name="Run %s" % testproject,
                                     description="Running %s" % testproject ,
                                     descriptionDone="Run %s done" % testproject,
                                     flunkOnFailure=False, warnOnFailure=True))

factory_continuous = BuildFactory()
factory_continuous.addStep(Git(repourl='https://git01.codeplex.com/forks/mariangemarcano/xunit',  mode='incremental'))
MSBuildFramework4(factory_continuous, 'Debug', 'build\\')
RunTests(factory_continuous, 'test.xunit.dll', 'Debug', 'test\\test.xunit\\bin\\Debug')
RunTests(factory_continuous, 'test.xunit.gui.dll', 'Debug', 'test\\test.xunit.gui\\bin\\Debug')

factory_ninghtly = BuildFactory()
factory_ninghtly.addStep(Git(repourl='https://git01.codeplex.com/forks/mariangemarcano/xunit', mode='full', method='clobber'))
MSBuildFramework4(factory_ninghtly, 'Release', 'build\\')
RunTests(factory_ninghtly, 'test.xunit.dll', 'Release', 'test\\test.xunit\\bin\\Release')
RunTests(factory_ninghtly, 'test.xunit.gui.dll', 'Release', 'test\\test.xunit.gui\\bin\\Release')

Builder Configuration


from buildbot.config import BuilderConfig

c['builders'] = []
c['builders'].append(
    BuilderConfig(name="Continuous",
      slavenames=["BuildSlave01"],
      factory=factory_continuous))
c['builders'].append(
    BuilderConfig(name="Ninghtly",
      slavenames=["BuildSlave01"],
      factory=factory_ninghtly))

Status notifications

You could also add MailNotifier to configure mail notifications.

c['status'] = []

from buildbot.status import html
from buildbot.status.web import authz, auth

authz_cfg=authz.Authz(
    # change any of these to True to enable; see the manual for more
    # options
    gracefulShutdown = False,
    forceBuild = True, # use this to test your slave once it is set up
    forceAllBuilds = False,
    pingBuilder = True,
    stopBuild = True,
    stopAllBuilds = False,
    cancelPendingBuild = True,
)
c['status'].append(html.WebStatus(http_port=8010, authz=authz_cfg))

Every commit done will trigger a continuous build that automatically compiles and runs tests. In the waterfall page you can see the people who has committed changes to the branch (view image bellow).

Buildbot-waterfall

Click on the person’s name to view commit’s detail information like repository, branch and revision. At the bottom there is a list of changed files. This is very helpful to track down any failures (view image bellow).

 change-detail

On my next blog post I’ll show you how to add customizations.

Tuesday, July 31, 2012

Buildbot Part I - Setting Up

Buildbot is a Python-based continuous integration system that consists of a buildmaster and one or more buildslaves, you can check it out on github.

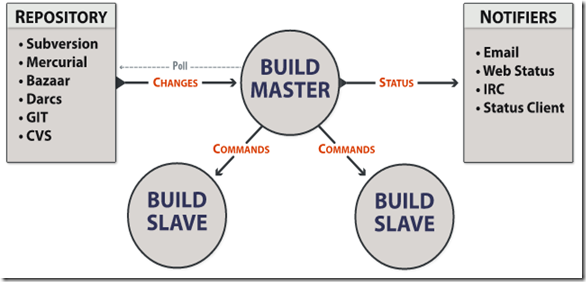
The buildmaster decides what, when and how the system is build, it has a configuration file called master.cfg where the build process is defined. On the other hand, the buildslaves handle the execution of the commands and return results to the master.

The following is a graph (from buildbot’s wiki) shows buildbot architecture supported repositories and notifiers.

buildbot

Setting up


To setup on windows, the master and slaves require:
Additionally, master requires:
Install buildbotmaster (http://buildbot.googlecode.com/files/buildbot-0.8.6p1.tar.gz) and buildbotslave (http://buildbot.googlecode.com/files/buildbot-slave-0.8.6p1.tar.gz)

For this example, I installed both on same machine, if the installation went ok you should be able to check their versions:

buildbotsetup

The following steps creates and starts the master and slave:

Create BuildbotMaster

C:\Python27\Scripts>buildbot create-master -r C:\BuildMaster

Create BuildbotSlave

C:\Python27\Scripts>buildslave create-slave C:\BuildSlave localhost:9989 BuildSlave01 mysecretpwd

Start BuildbotMaster

C:\Python27\Scripts>buildbot start c:\BuildMaster

Start BuildbotSlave

C:\Python27\Scripts>buildslave start c:\BuildSlave

if everything went fine you should see a page like the following:

buildbotpage

You can check for errors on C:\BuildMaster\twistd.log and C:\BuildSlave\twistd.log.

Who is using buildbot:  Python, Mozilla, Google Chromium and others. The following shows Python 2.7 waterfall page:

PythonBuildbot

On my next post I’ll show you how to run automated builds and tests for a .net application hosted on git/codeplex using buildbot.

Wednesday, June 27, 2012

Virtualization using Proxmox VE

Proxmox Virtual Environment is an open source virtualization platform for running virtual machines with a web UI to manage the VMs and view resource usage. It allows 32/64 bit Windows, Linux and more.
 
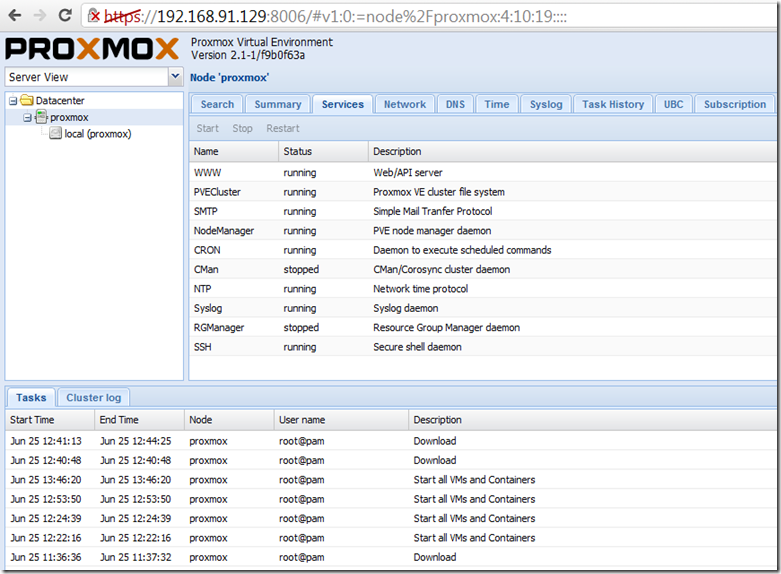
I would like to share some information about Proxmox and a few common actions I learned on a previous project. Although I used an earlier version, I just installed version 2.1, here is an installation video. I found that the UI completely changed and more features were added, below a sample screen of the management UI showing the services of the host and another one with the VM guest console.

HostServices

proxmoxconsole

Location of VM and config files

VM images:
proxmox:/var/lib/vz/images# ls
101 102

VM configurations:
proxmox:/etc/pve/openvz# ls
100.conf

or
proxmox:/etc/pve/qemu-server# ls
101.config

Previous version:
proxmox:/etc/qemu-server#


Backup

The backup tool used for OpenVZ containers and KVM is called vzdump; if you are using the UI, first create a backup directory on Datacenter->Storage (using the new UI), and select 'Backup' as content for that storage. If you don’t have a storage created, you will get “Can’t use storage for backups – wrong content type” error.

backup
There are other options to backup an image with no downtime for example using the snapshot mode.


Create a vm image

You can create a vm via command line or using the web UI.

The following example creates windows 2003 vm with 3G of ram and using 1 core/socket CPU.

qm create 101 --name BuildSlave01 --vlan0 virtio=DA:28:61:58:71:5B --ide2 none,media=cdrom --bootdisk ide0
--ostype w2k3 --memory 3072 --sockets 1 --onboot no --cores 1 --virtio0 local:100,format=qcow2

Make sure to assign a new mac address every time a vm is created.


Restore from a backup

To restore use vzrestore for OpenVZ containers or qmrestore for KVM machines.

restorevm


Copy VM image

It is also possible to copy the vm disk image from one virtual machine to another, doing this will keep each vm configuration separate.
proxmox:/var/lib/vz/images# cp 101/vm-101-disk-1.qcow2 106/vm-106-disk-1.qcow2 


Extend vm disk size

The following example will add 20G to the vm.
qemu-img resize vm-101-disk-1.qcow2 +20G


You can use gparted to make this space available on windows server 2003 c:\ drive. First, upload the iso image on proxmox and then boot the vm from cd using uploaded gparted iso image.


Converting image formats

The qemu-img program can be used to convert images from one format to another. For example:
qemu-img convert -O qcow2 MyVmwareImage.vmdk MyProxmoxImage.qcow2

Wednesday, November 9, 2011

Getting your App Continuously Tested

Being able to identify issues quickly and having an automated system that tells us whether or not the application is broken, sounds like a must have practice for software development companies nowadays. Nevertheless, we are still facing many challenges specially on large and complex systems.

So where do we start?

In my opinion, the first step in getting automated is having a CI (Continuous Integration) system in place and making sure the builds cover major branches.

The CI system needs to be able to deploy and run the application in isolation per branches, for example using different virtual machines / databases. This way we can make sure we have a known state of all resources and that we are able to roll back to that state after the tests run. Having the hardware/software resources needed for this is key to success.

In many cases, we may require changing the way the application is built and deployed, using tools and creating scripts that runs steps automatically in CI.

Being able to run tests automatically in CI

Select the tools that allows you to run automated tests unattended and getting tests results reports in CI. This way we make sure all the tests are executed after every code change, and that we also are able to run many tests on different environments/configurations.

Creating the tests

Get the whole team involved and make the creation of different levels of automated tests a part of development activities. Consider the team may need to improve their code design skills, which leads to testable code. Most of us have heard high cohesion and low coupling, for a long time; unfortunately it is common not seeing these applied.

Automated tests general guidelines

  1. The test should communicate intent: it should be clear and simple what the test is verifying, and how the functionality is used by the application.
  2. The test must have an assert.
  3. The test must pass and fail reliably. The test should not have code branches i.e. if/else statements that cause it to not give a reliable pass/fail.
  4. If for some reason, the test has code branches, there must not be one that doesn’t have an assert.
  5. Keep tests independent: As tests grow, running the tests sequentially may be unpractical, so we need to make sure we can run tests in parallel and get quick feedback.
  6. There must be a way to run separately unit, integration and end to end tests. The distinction between these must be clearly understood.
  7. Unit tests must run fast.
  8. Do not comment tests when they start failing, fix them.

This list can grow very long but at least this can be a good start =)

Hope this summary helps you and your team getting automated.

Wednesday, November 2, 2011

Visual Studio Debugging and Remote Debugging

This time I would like to share some notes gathered from different sources about debugging: how visual studio handles different builds (Debug and Release) and how we can debug code that has been deployed to a remote machine.

Debug, Release Build

Like most of you know visual studio projects has some predefined build configurations: Debug and Release. Using Debug, the program is compiled with full symbolic debug information and no optimizations.

With Release the program is compiled using Optimize code and  pdb-only options. The pdb-only option does not generate the DebuggableAttribute that tells the JIT compiler that debug information is available, but generates a .pdb (program database) file to allow viewing information such as source filenames and line numbers in the application’s stacktrace.

Optimized code is harder to debug since the compiler repositions and reorganizes instructions to get a more efficient compiled code, so generated instructions may not correspond directly to the source code. Some optimizations are always performed by the compiler and others only performed when the Optimized code option is set; optimization may include things like: constant propagation, dead code elimination. .Net runs optimizations in 2 steps: one optimization run by the compiler when generating the IL code and other when running the application and transforming IL to machine code, most optimizations are left to the JIT compiler.

While reviewing more about it, it seems that optimization is separate from pdb generation so pdb-only generation shouldn’t affect performance in most scenarios and it is recommended to produce PDB files, even if you don't want to ship them with the executable.

In order to debug an application with visual studio, we require the matching pdb file: The debugger looks for the PDB files using the dll or executable name and looks for [applicationname].pdb. When .dll, executable, and PDB files are generated it creates and stores identical GUIDs in each file. The GUID is used to determine if a given PDB file matches a DLL or an executable file.

You can use DUMPBIN to see if pdb files are found for a given dll, for example:

e:\Program Files (x86)\Microsoft Visual Studio 9.0\VC>dumpbin /pdbpath:verbose 
"e:\Projects\VS 2008\RemoteDebugging\WpfApplication1\bin\Release\WpfApplication1.exe"

Microsoft (R) COFF/PE Dumper Version 9.00.30729.01
Copyright (C) Microsoft Corporation.  All rights reserved.

Dump of file e:\Projects\VS 2008\RemoteDebugging\WpfApplication1\bin\Release\WpfApplication1.exe

File Type: EXECUTABLE IMAGE
  PDB file found at 'e:\Projects\VS 2008\RemoteDebugging\WpfApplication1\bin\Release\WpfApplication1.pdb'

  Summary

        2000 .reloc
        2000 .rsrc
        2000 .text

e:\Program Files (x86)\Microsoft Visual Studio 9.0\VC>

and GUID information can be inspected using DUMPBIN as well:

e:\Program Files (x86)\Microsoft Visual Studio 9.0\VC>dumpbin /headers 
"e:\Projects\VS 2008\RemoteDebugging\WpfApplication1\bin\Release\WpfApplication1.exe"
.....

Dump of file e:\Projects\VS 2008\RemoteDebugging\WpfApplication1\bin\Release\WpfApplication1.exe
.....

Debug Directories

      Time Type       Size      RVA  Pointer
  -------- ------ -------- -------- --------
  4D97EE82 cv           6C 00003708     1908    Format: RSDS, 
  {9873ECF8-BA29-4C84-9AF5-BC54B1E6FFD4}, 1, E:\Projects\VS 2008\RemoteDebugging\WpfApplication1\obj\Release\WpfApplication1.pdb

Another interesting feature around .net debugging is configuring an executable image for debugging,  if you want to debug [application].exe, create a text file named [application].ini, in the same folder having this information:

[.NET Framework Debugging Control]
GenerateTrackingInfo=1
AllowOptimize=0

This tells JIT compiler to generate tracking information and not run optimizations, making it possible for the debugger to match up MSIL and not optimizing resulting machine code.

Remote debugging

To remote debug a .net application you can use the visual studio remote debugger (msvsmon.exe),
Both machines should have access/permissions to connect to each other. Start  visual studio remote debugger on the machine running the application, this will start visual studio remote debugging monitor displaying the following information.

Msvsmon started a new server named 'Domain\user@machinename'. Waiting for new connections.
machine\user connected. 

On the machine you want to debug, start visual studio and on the attach to process windows, set Qualifier to the remote debugger server name. In this example 'Domain\user@machinename' use the mane as it appears.